
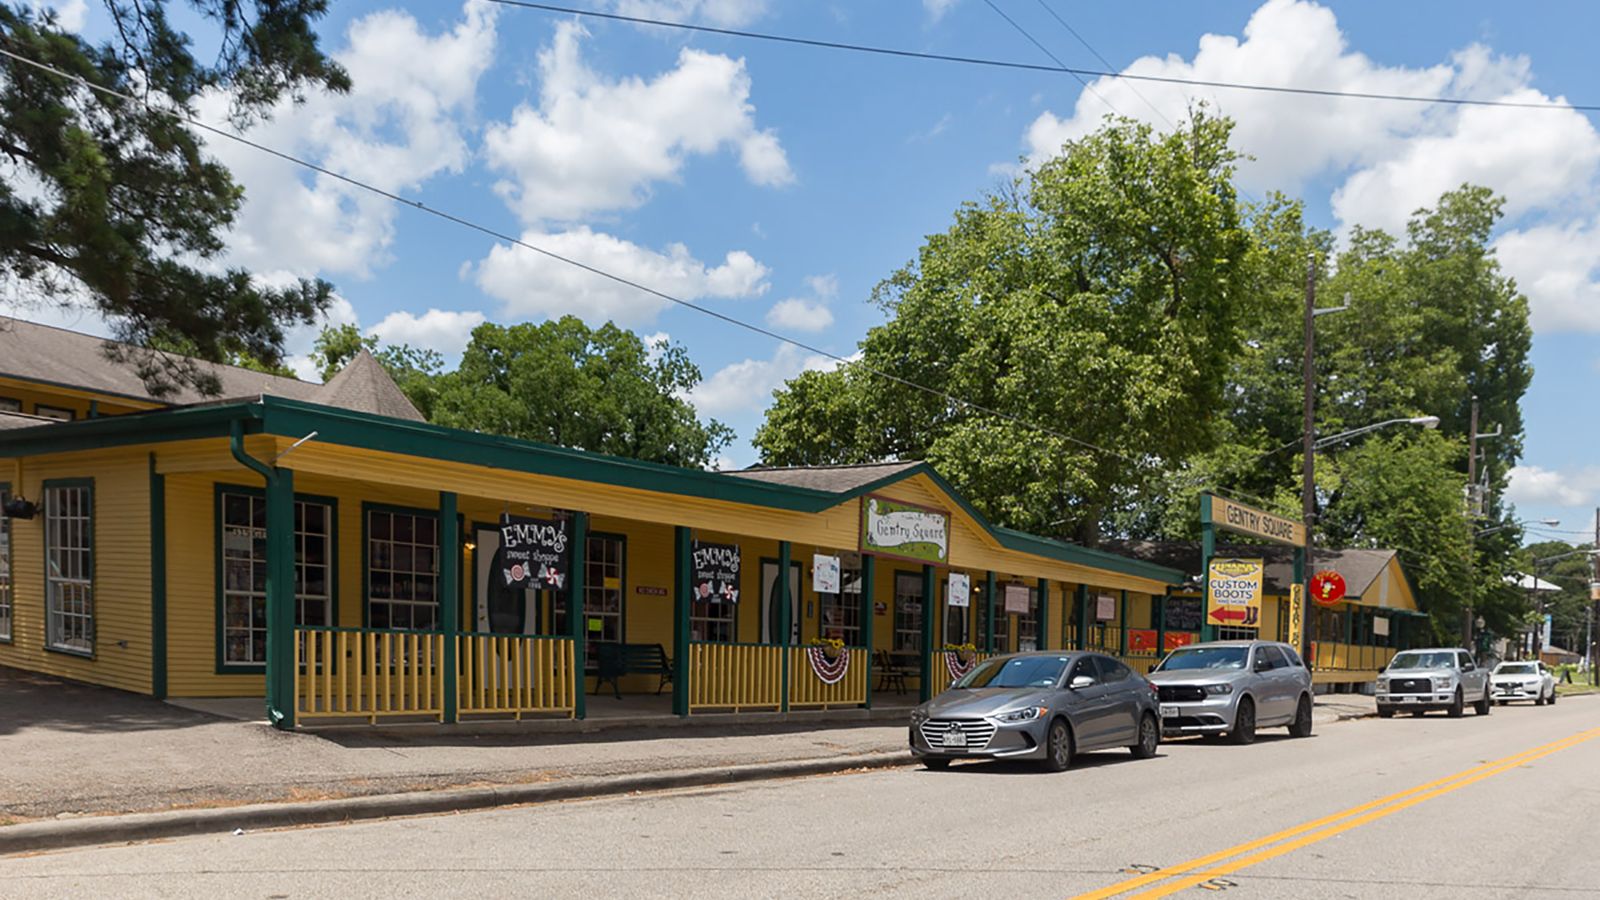
Investing in Spring, TX
Rents, prices, taxes and cash flow for Spring rental property, from 3,927 home sales and 2,871 house leases on HAR MLS. Updated October 2026.
Is Spring, TX a good place to buy a rental property in 2026?
At typical prices a financed rental in Spring does not cash flow right now. An entry-level 3-bed house ($221,000, the 25th-percentile sale) rents for about $1,750 a month, a 9.5% gross yield and a 0.91 lender DSCR. With an 80% DSCR loan, estimated cash flow is −$636 a month after the loan, taxes, insurance, vacancy, management and repairs. A 1.25 DSCR, what most DSCR lenders want, needs a purchase at or under $158,622; 3% of last year's 3-bed sales closed that low on the MLS. That is why investors here buy below market: off-market, distressed or needing work.
Spring investor market report
The same sections as our monthly Investor Market Update, for Spring: resale houses closed 2025-10-18 to 2026-10-18, HAR MLS.
▲▼ = change vs the 12 months before (2024-10-18 to 2025-10-18). Resale single-family houses, new construction excluded.
1,583 single-family homes active, 326 pending, against 328 closings a month (new builds included). Under 4 months favors sellers, over 6 favors buyers.
Loan: DSCR 30-yr fixed quote from Blink Lending (2026-10-14), 80% of price, 30 years; cash in = down payment + 3% closing costs ($50,830). Tax at the city's median MLS tax rate, insurance 0.9% of price a year, HOA where most homes have one, and vacancy 8%, management 8%, repairs 5%, capex reserve 5% of rent. An estimate, not a promise.
- In 100-year flood zone
- 2% of resale homes sold
- Flood claims, 10 years
- 3,221 FEMA NFIP, city ZIP codes
- Property tax rate
- 2.35% median on MLS, incl. MUD/PID
- HOA
- $600/yr 91% of homes · check lease rules
- Insurance (estimate)
- 0.9% of value ≈ $166/mo
- Cash buyers
- 22% of 580 sales reporting terms
- Days to lease
- 30 days ▼ 2 days
- Rental supply
- 3.6 mo 926 for lease now
- Prices up 0.6% vs last year, days on market +5. Balanced at 4.8 months. 72% of sellers ended below their original price, so there is room to negotiate on stale listings.
- An entry-level 3-bed house ($221K, ~$1,750/mo) is a 0.91 lender DSCR. A 1.25 needs a buy at or under $159K, and 3% of last year's 3-bed sales closed there.
Rates: 30-year fixed average 7.40% (2026-10-15), 6.27% a year earlier; 15-year 6.71% (Freddie Mac via FRED). Investor DSCR loan quote 7.875% (Blink Lending, 2026-10-14).
The math works below market. That is where our deals are.
We source off-market and distressed houses in Spring and across Houston, and send them to investors whose buy box fits, with our numbers attached. Free account, no obligation.
Spring ZIP codes compared
3-bedroom resales and 3-bedroom house leases by ZIP code, last 12 months. Flood claims are FEMA flood insurance claims in the last 10 years.
| ZIP | Median price | Median rent | Gross yield | Sales | Leases | Flood claims (10 yr) |
|---|---|---|---|---|---|---|
| 77373 | $223,000 | $1,795 | 9.7% | 442 | 496 | 627 |
| 77386 | $295,000 | $1,995 | 8.1% | 273 | 378 | 446 |
| 77379 | $290,000 | $1,950 | 8.1% | 210 | 184 | 785 |
| 77388 | $264,450 | $1,950 | 8.8% | 190 | 242 | 327 |
| 77389 | $345,000 | $2,100 | 7.3% | 117 | 102 | 235 |
| 77380 | $260,000 | $1,850 | 8.5% | 42 | 66 | 644 |
| 77382 | $444,000 | $2,500 | 6.8% | 16 | 13 | 33 |
| 77381 | $399,000 | $1,950 | 5.9% | 11 | 27 | 124 |
Spring subdivisions with the most rental activity
Subdivisions with at least 6 sales and 6 house leases in the last 12 months. All home sizes, so compare like with like before you offer.
| Subdivision | Median price | Median rent | Gross yield | Sales | Leases |
|---|---|---|---|---|---|
| Cypresswood Landing | $265,000 | $1,950 | 8.8% | 10 | 57 |
| Gleannloch Farms | $530,000 | $2,850 | 6.5% | 59 | 7 |
| Woodson's Reserve | $649,000 | $3,650 | 6.7% | 35 | 18 |
| Harmony | $439,900 | $2,500 | 6.8% | 36 | 12 |
| Falls At Imperial Oaks | $444,100 | $2,695 | 7.3% | 38 | 8 |
| Canyon Gate At Legends Ranch 0 | $305,000 | $2,175 | 8.6% | 13 | 25 |
| Forest Village | $280,000 | $2,150 | 9.2% | 26 | 9 |
| Northampton | $430,000 | $2,500 | 7.0% | 28 | 6 |
| Breckenridge Forest | $255,000 | $1,900 | 8.9% | 12 | 19 |
| Imperial Oaks | $297,500 | $2,200 | 8.9% | 20 | 9 |
Spring investor questions
How much does a house rent for in Spring, TX?
What do homes sell for in Spring, TX?
What are property taxes in Spring, TX?
Is Spring a buyer's or seller's market right now?
Which ZIP code in Spring has the best rent-to-price?
Does Spring flood?
Compare other Houston areas
Also for Spring: what homes sell for · buying a home.
Sources: HAR MLS closed sales and leases (single-family houses); Freddie Mac 30-year average rate via FRED; FEMA National Flood Insurance Program claims (OpenFEMA). Data as of 2026-10-20. Medians of single-family homes and house leases in the Spring postal city (Harris and Montgomery counties). Based on information from the Houston Association of REALTORS® MLS; not guaranteed accurate. Nothing here is a guarantee of returns. Verify every number with your own due diligence.
Want deals in Spring?
Tell us your market, budget and strategy. We will send deals that fit, or run a free CMA on a property you are looking at.
Prefer email? hello@gableway.com